This is not do or die trading advice. This is where trading meets psychology, and they go out on a date. Not all dates work out. It’s not necessarily anyone’s fault. Some people just aren’t compatible. This is why first dates exist, by the way. To check compatibility.
Your blind date tonight is a lady called trend following. She likes things slow, so don’t rush her. She might take an hour or two just on the drinks’ menu, and forget about her showing up on time. She’s also very picky. She’s apt to return plates to the kitchen untasted, by the dozen.
But if she likes something, if her juices get flowing, if she gets excited, look out! This lady might not stop for months. You’d think you would get tired of her, but you don’t. She gives you so much more than she takes. But only if you treat her right, if you’re patient, if you wait for her to get excited on her own, because it’s really not about you. It never was. She’ll get excited with anyone, if they let her do it on her own terms.
Okay, the analogy breaks down there, towards the end. It suddenly sounds like she’s loose. Let me bring it back to trading terms. Trend following is a long-term trading approach where one very patiently waits for a trend to be established, and then one rides it as far as it will go. The problem is that these trends don’t happen every day. Or every week. In fact, you might go months without a good trend. Meanwhile, you’re taking Lady Trend Following on date after date, picking up the check each time, just patiently waiting for her to get frisky.
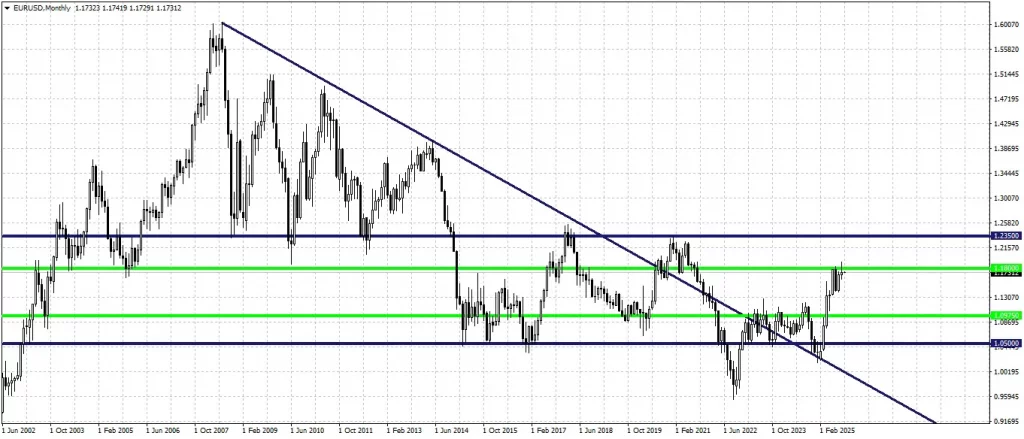
Here’s the EURUSD on a monthly view. From mid-2002 to 2008, the EURUSD was in a nice uptrend, going from 0.92000 all the way up to 1.60000. That’s 6,800 pips. That’s $68,000 on a full lot, over about 6 years. Of course, if you’d been adding to the trade along the way, and why wouldn’t you, it might be quite a few multiples of $68,000, before the trend ended. Then, of course, the trend reversed, and you could’ve made all that money all over again, on the way down. Multiple times, too. The last few years, however, the EURUSD has been in a narrow sideways channel of barely 400 pips, and only this year did it finally break out of it.
You will also note a very strong level of support/resistance at 1.23500, which has served since 2008 as both a target and a launchpad. Trade towards 1.23500 from above and from below, taking profit each time and reversing the trade. But between 2022 and early 2025, the EURUSD went into hibernation. Until, just a few months ago, it woke up, and we’re trading towards 1.23500 again.
The thing about all this is that these trends are only obvious and crystal clear after the fact. You can see when a trend starts, but you can’t know how long it will last until it’s over. All you can do is get in and ride it out. Many times, they’ll be false starts. A breakout that fails. A reversal that doesn’t reverse. But we still have to jump in each time, if we want to eventually be in that 6,800 pip trade.
Each time it doesn’t work out, you’re out a few hundred bucks, maybe a couple of thousand. And it doesn’t work out a lot more times than you’d think. Maybe ten times it doesn’t work out, and then it suddenly does. You were down $3,000 altogether, almost losing faith, when boom! You catch a trend and you’re up $10,000, recovering that $3,000 and then some. But only if you kept the faith.
And, remember, it’s not just the EURUSD. I’m doing this on 28 different instruments, just on the Forex. At random, let’s check another chart.
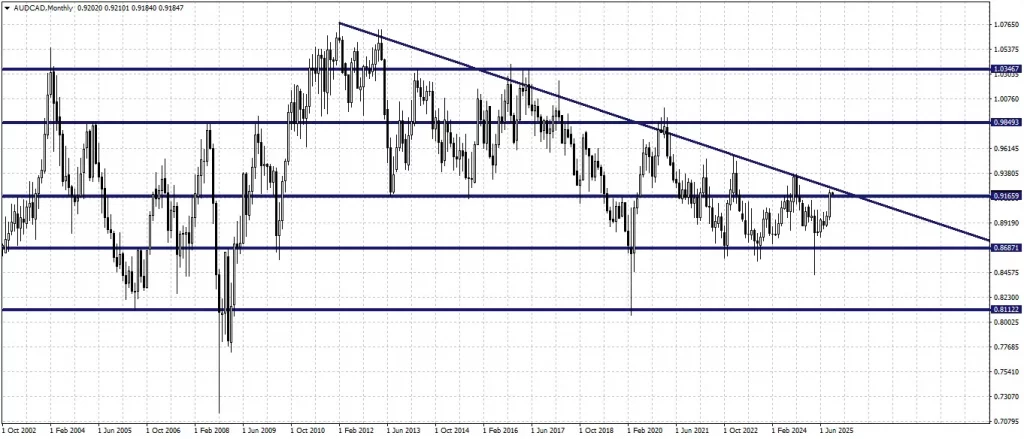
The AUDCAD has been in a downtrend for 15 years now. As long as it doesn’t break the trend line, all we do is sell when it bounces off of it. Protecting and/or taking profit each time it gets to the lower levels of support. If it bounce off of those and starts going up again, we buy towards the trend line. Is it 6,800 pips each time? I wish. It was, though. But the movements are getting smaller now. A clear signal that this downtrend might be winding down. Then we’ll have a new uptrend where we might again see those thousands of pips materialize.
But these movements literally take years to play out. And pay out. Most charts will be in between movements at any given time, too, and you have to decide whether to pursue a lesser potential payout. Which you normally should, because a few thousand dollars of profit every now and then pads the books nicely. Remember, those 6,800 pip trades don’t come around every year. All that’s assuming you have enough margin and you’re analyzing the charts properly.
So what does my trading look like? Once a quarter, at the beginning of it, I review all my monthly and weekly charts. For example, EURUSD monthly and weekly.

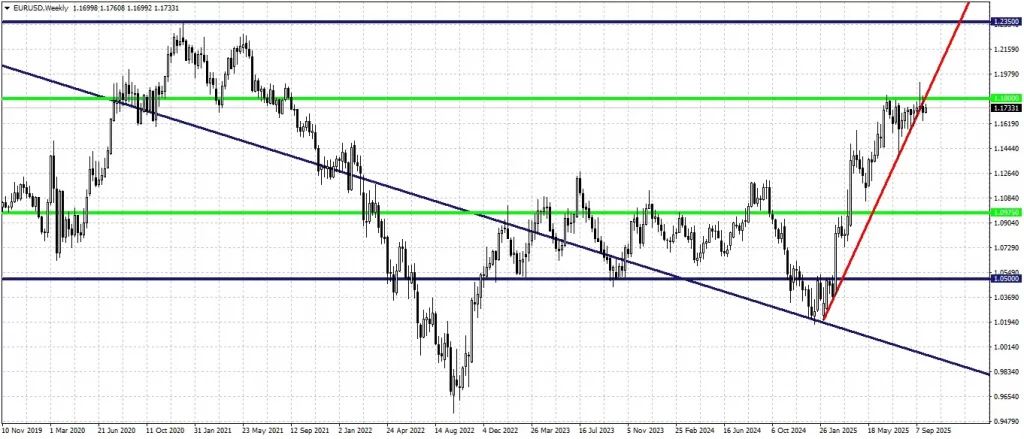
I identify all the active levels of support/resistance and any ongoing trends., color-coding them accordingly. Blue are monthly levels, green are weekly levels, and red are daily levels. Sometimes it’s almost poetry, like the monthly here, and other times less than picture-perfect, like the weekly here. These charts don’t change very often. They’re almost glacial in permanence. I finally look at the daily, and decide which levels and trends will display in the higher or lower timeframes.
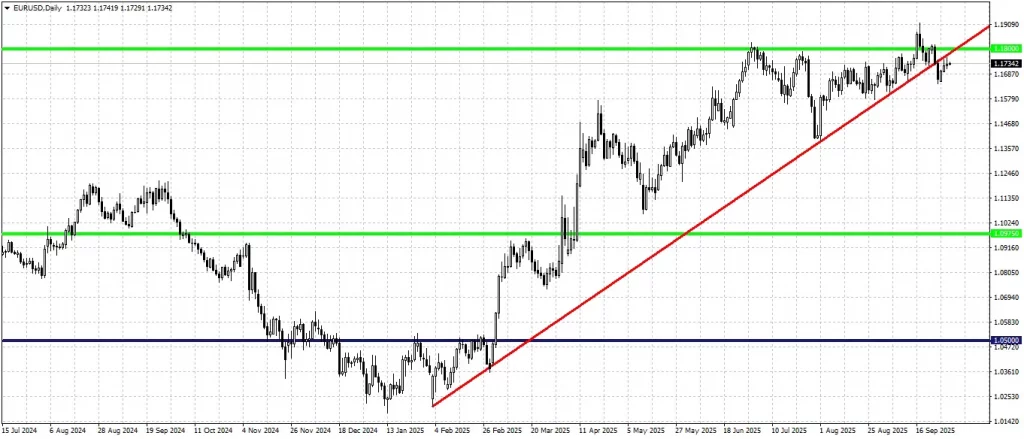
Although I am always aware of the stronger levels of support/resistance and trends from the higher timeframes, I will look for entries only on the daily charts. For example, a trend line break on the daily (red) here will lead me to short the EURUSD, trading it towards the weekly support (green) around 1.10000. On a continuation of the daily (red) trend, however, which necessarily pierces the weekly (green) level of resistance at 1.18000, I go long, attempting to trade it to the next level of monthly (blue) resistance (visible on the weekly chart) at 1.23500.
I’m simplifying it somewhat, because when I look at the daily charts, I also overlay other indicators and methods. It might end up looking like this.
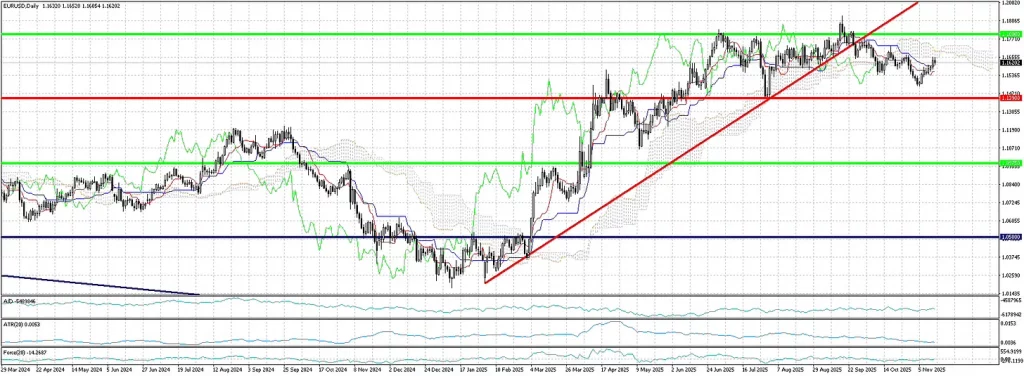
I’m looking at the Ichimoku Kinko Hyo, the average true range over the last 20 days, the current accumulation/distribution, and the Force Index, also for the 20 days, as well as everything I was already looking at. You’ll note that price did break the trend line, and it’s zigzagging its way down to the daily support level at 1.14000 as we speak. The daily chart is always fluid and dynamic, while my targets are in the weekly or monthly charts, and much less mutable.
As long as price stays below the daily trend line and below the weekly resistance AND the Ichimoku is in strong sell mode AND the A/D and Force Index are bearish, I’ll be shorting this pair. If price breaches resistance and/or the Ichimoku and other indicators’ signals turn bullish, I’ll exit and start going long, instead. Always looking, hoping, for a big move, but happy picking up a few hundred or thousand dollars on a lesser move. Those pay the bills, too. But it’s catching a massive trend that doubles or triples my account balance.
Notice that my “beliefs” and “opinions” don’t factor into any of this. I drew monthly, weekly, and daily levels of support/resistance, and active trends. I note where these are relative to current price and direction on all timeframes down to the daily. I overlay a few other things on to the daily chart, and then I apply a series of rules or filters every time I look at a daily chart. Applying my rules or filters, which is what I call a system, every chart gives me 3 immediate alternatives, and no more. Go long, go short, or don’t trade.
I look at the 28 daily charts I actively trade a couple of times a week. It takes me less than a minute per chart. In less than half an hour, twice a week, I know whether I want to trade something up, down, or not at all. My rules also tell me at what position size, and where to place stops or limits. Occasionally, my rules also tell me to get out of an open trade, or adjust it. It doesn’t matter whether I feel bullish or bearish, what matters is my system, my rules. And my quarterly task of updating the long-term charts takes a couple of hours every three months.
I’m never going to be “the guy who predicted the great market crash of 2026”, because I’m not in the predicting game. All I care about is making money over time. If I go long and lose, that’s the cost of doing business. I am routinely and frequently wrong, because the market doesn’t obey me or care where I draw my lines. But when a trade works out, I make up for any losing trades and then some. That’s all that matters to me, account growth over time while keeping risk contained. Despite the fact that I can lose often and for extended periods, my losses are always small. Much smaller than my winners.
Are there viable systems (rules and filters) that aren’t trend following and work well on shorter timeframes? Tons. But they also require you to scan those charts every hour, or even every minute. That’s not me. To go back to my dating analogy, doing it on a very small timeframe would be like speed-dating, where you talk to a person for about 5 minutes, and then move on to the next person, also for 5 minutes. You might meet dozens of potential girlfriends this way, and some people like that. I’ll stick to my capricious Lady, Trend Following, and her very slow ways.
I’m not telling you that you’re wrong to do otherwise, I’m just telling you how I operate. Heck, the short-term, speed-dating trader might make more profit than I do, in any given year, but he’s working 8+ hours a day. I’m working less than an hour a week, and I make enough already.
This is where the psychological component comes into play. Some of us are psychologically better suited to the long-term and trend following. Others will be short-term speed-daters. And everything else in between, too. As long as you’re properly analyzing your charts, and using an appropriate system for your entries and trade management, you’ll probably do well.
I can go months without a decent trade, and then double or triple my account in another month or two, before going back to being “bored” again for months. A short-term trader might open as many trades in a month as I open in a year, and make as much profit as I do, but they’ll put in a lot more hours than I do. You can’t trade against the grain of your psychology, though. You have to know what kind of a trader you are. I’m a long-term trader. I don’t get bored. What kind of trader are you?
By the way, this is the Bible for trend following which, as a system, has been steadily producing money for smart, patient traders since the Middle Ages, if not longer.
Click here to get it.
Buy a subscription to any of our Trading Services, the FX CopyTrader, the FX Trading Room, or our FX Signals, and get the other two for free! No coupons needed. You'll be subscribed to all 3 automatically no matter which one you purchase!
Andy Pedraza
Latest posts by Andy Pedraza (see all)
- Haste Makes Waste - April 16, 2026
- Black Swans - January 4, 2026
- Why Size Matters - December 21, 2025